Sullivan's Island is a narrow barrier island approximately 4 miles long and 0.5 miles wide, situated at the mouth of Charleston Harbor. The island is bounded by the Atlantic Ocean to the northeast and the Intracoastal Waterway to the southwest, leaving properties exposed to surge from multiple directions during major hurricane events. Mean land elevation on the island ranges from approximately 5 to 10 feet NAVD88, with some areas well below the Base Flood Elevation. The island's barrier island geomorphology — characterized by mobile, sandy substrate and dynamic shoreline processes — makes it inherently more vulnerable than mainland or high-bluff coastal settings. The nearest NOAA tide gauge is located at Charleston, SC (Station 8665530), approximately 6 miles southwest.
The Charleston, SC tide gauge has recorded a local relative sea level rise rate of 3.73 mm/year — one of the higher rates on the US East Coast, reflecting both global ocean warming and local land subsidence. This rate has accelerated in recent decades. NOAA's 2022 Interagency Sea Level Rise Scenarios project that under an intermediate planning scenario, the Charleston area will see approximately 1.6 feet of additional sea level by 2050 relative to 2000 baseline levels. Under a high scenario — reflecting accelerated Antarctic and Greenland ice sheet loss — that figure rises to 5.5 feet by 2100. The satellite imagery below illustrates projected inundation extent at this parcel under the intermediate scenario.
| Scenario | 2030 | 2050 | 2075 | 2100 | Description |
|---|---|---|---|---|---|
| Low | +0.2 ft | +0.4 ft | +0.7 ft | +1.0 ft | Assumes rapid emissions reduction |
| Intermediate | +0.3 ft | +1.6 ft | +2.0 ft | +3.5 ft | NOAA planning benchmark scenario |
| High | +0.4 ft | +1.1 ft | +2.6 ft | +5.5 ft | Assumes accelerated ice sheet loss |
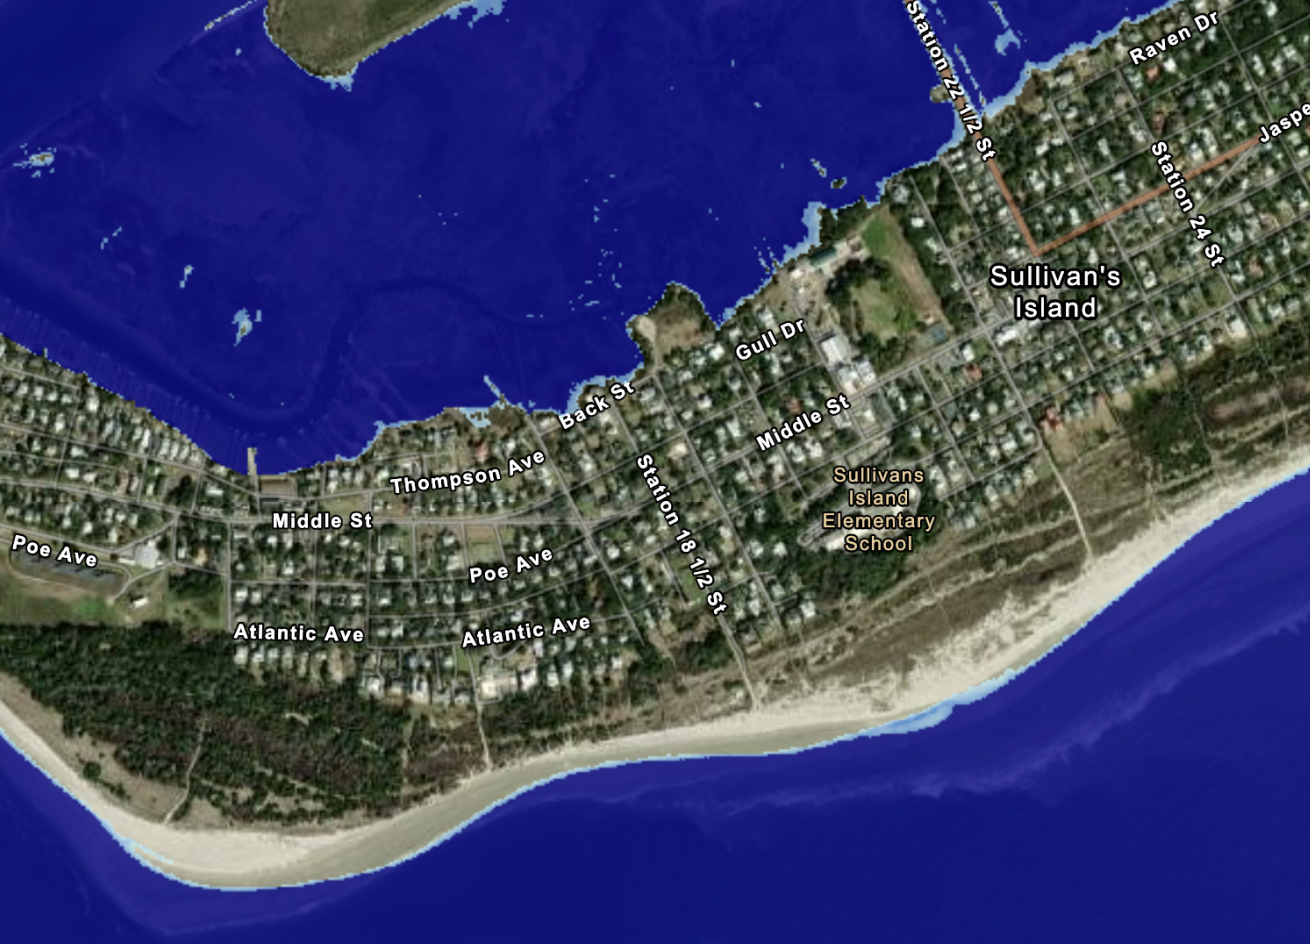
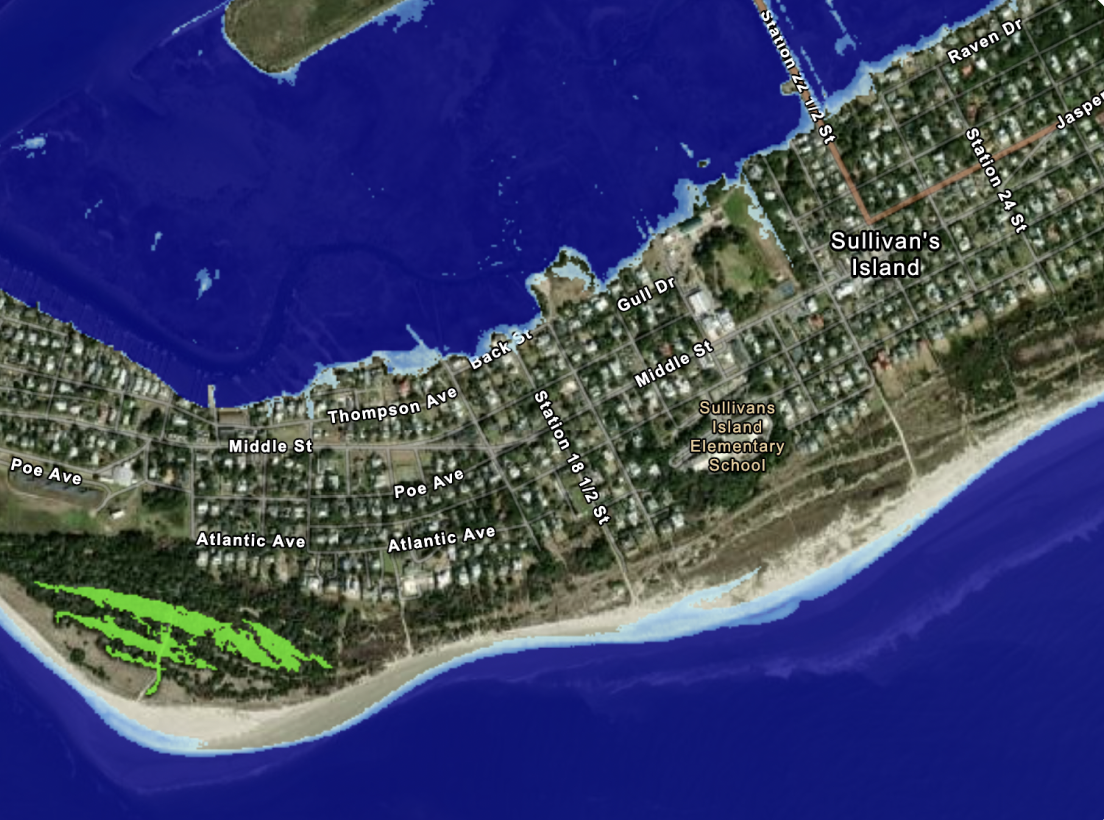
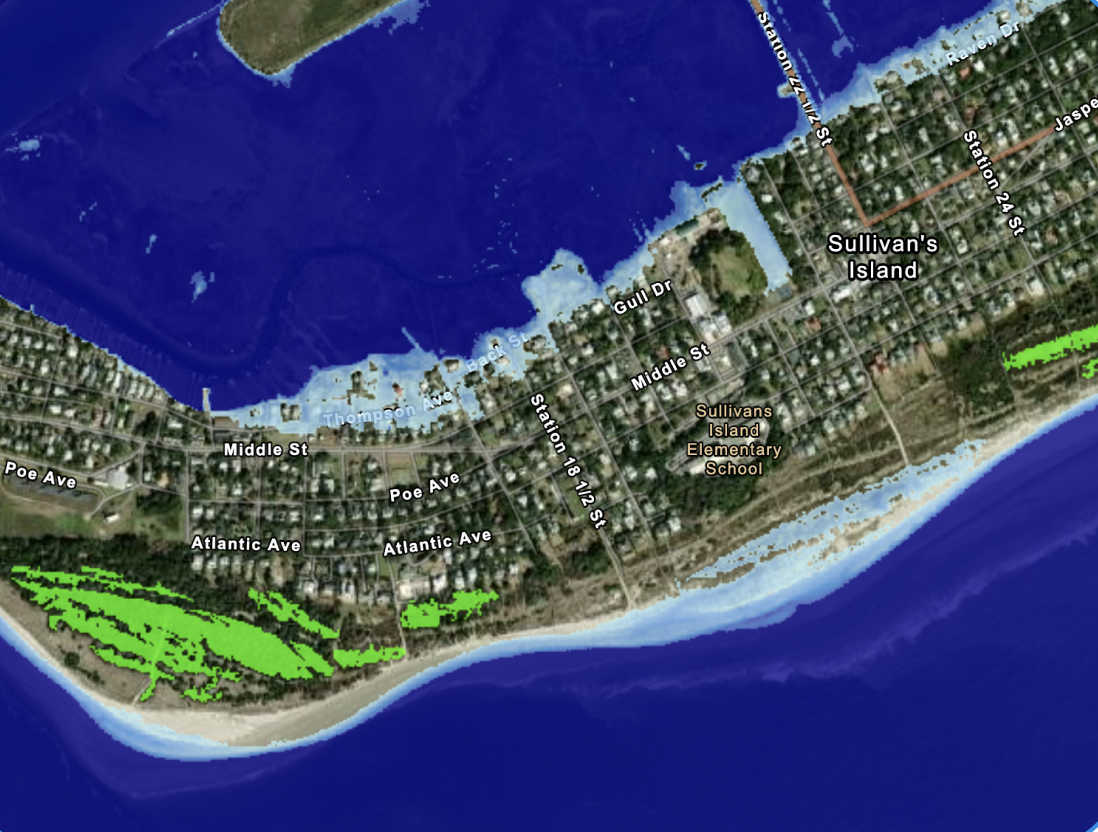
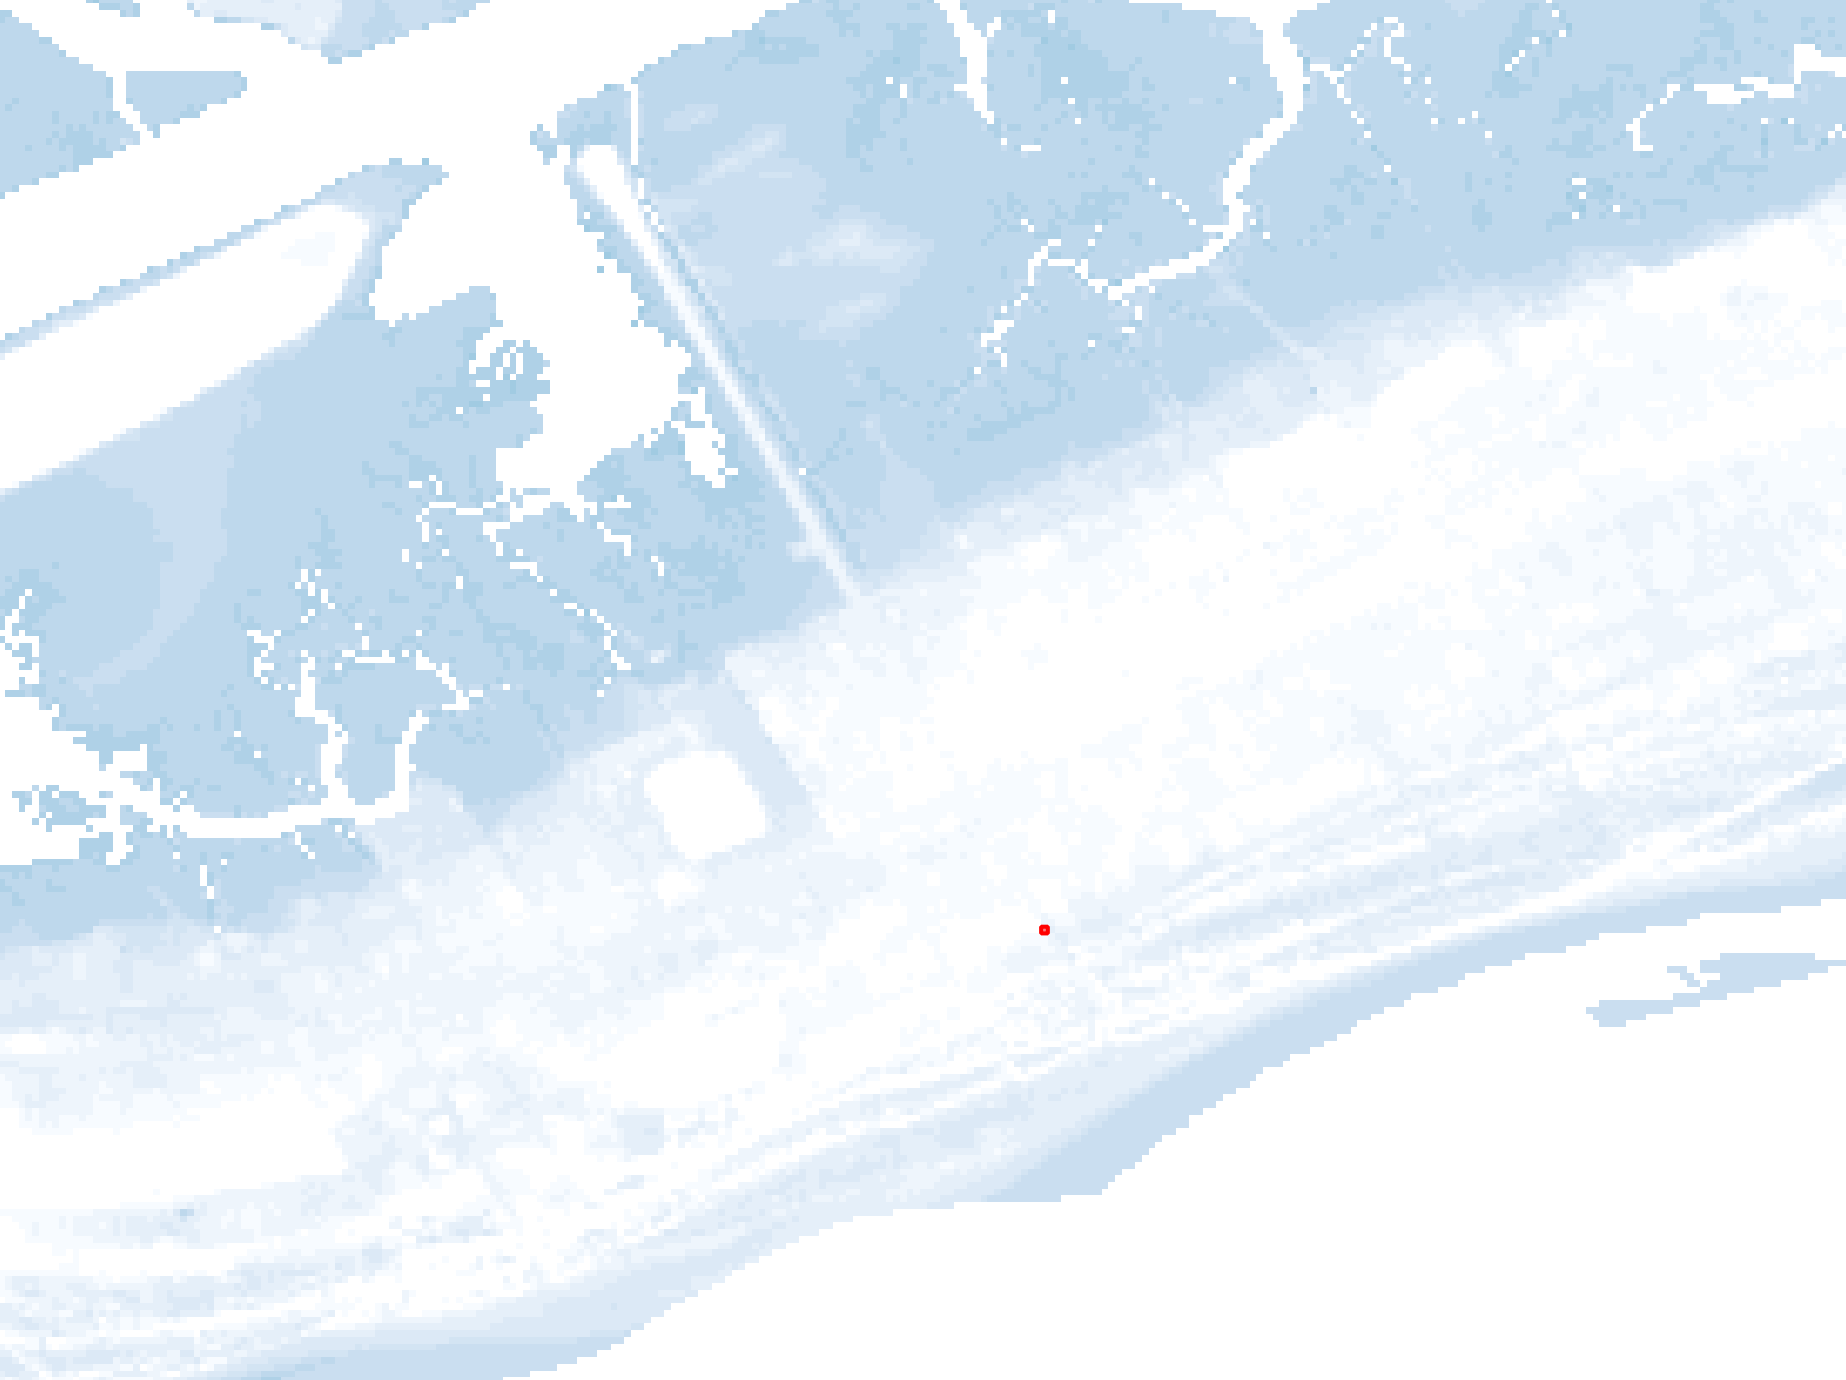
Sullivan's Island is directly exposed to Atlantic hurricane storm surge with no significant offshore barrier protection. Surge depths are estimated using NOAA's SLOSH Maximum of Maximums (MOM) product, which represents the upper envelope of modeled surge heights across thousands of synthetic storm tracks making landfall near this location. These figures represent worst-case estimates for each category and should be interpreted as planning-level bounds rather than precise predictions. The interactive simulation below provides a visual reference for how increasing surge depths interact with a typical coastal structure.
| Hurricane Category | Wind Speed | Estimated Surge Depth | Relative Depth |
|---|---|---|---|
| Category 1 | 74–95 mph | 2 ft | |
| Category 2 | 96–110 mph | 6 ft | |
| Category 3 | 111–129 mph | 10 ft | |
| Category 4 | 130–156 mph | 14 ft | |
| Category 5 | 157+ mph | 17 ft |
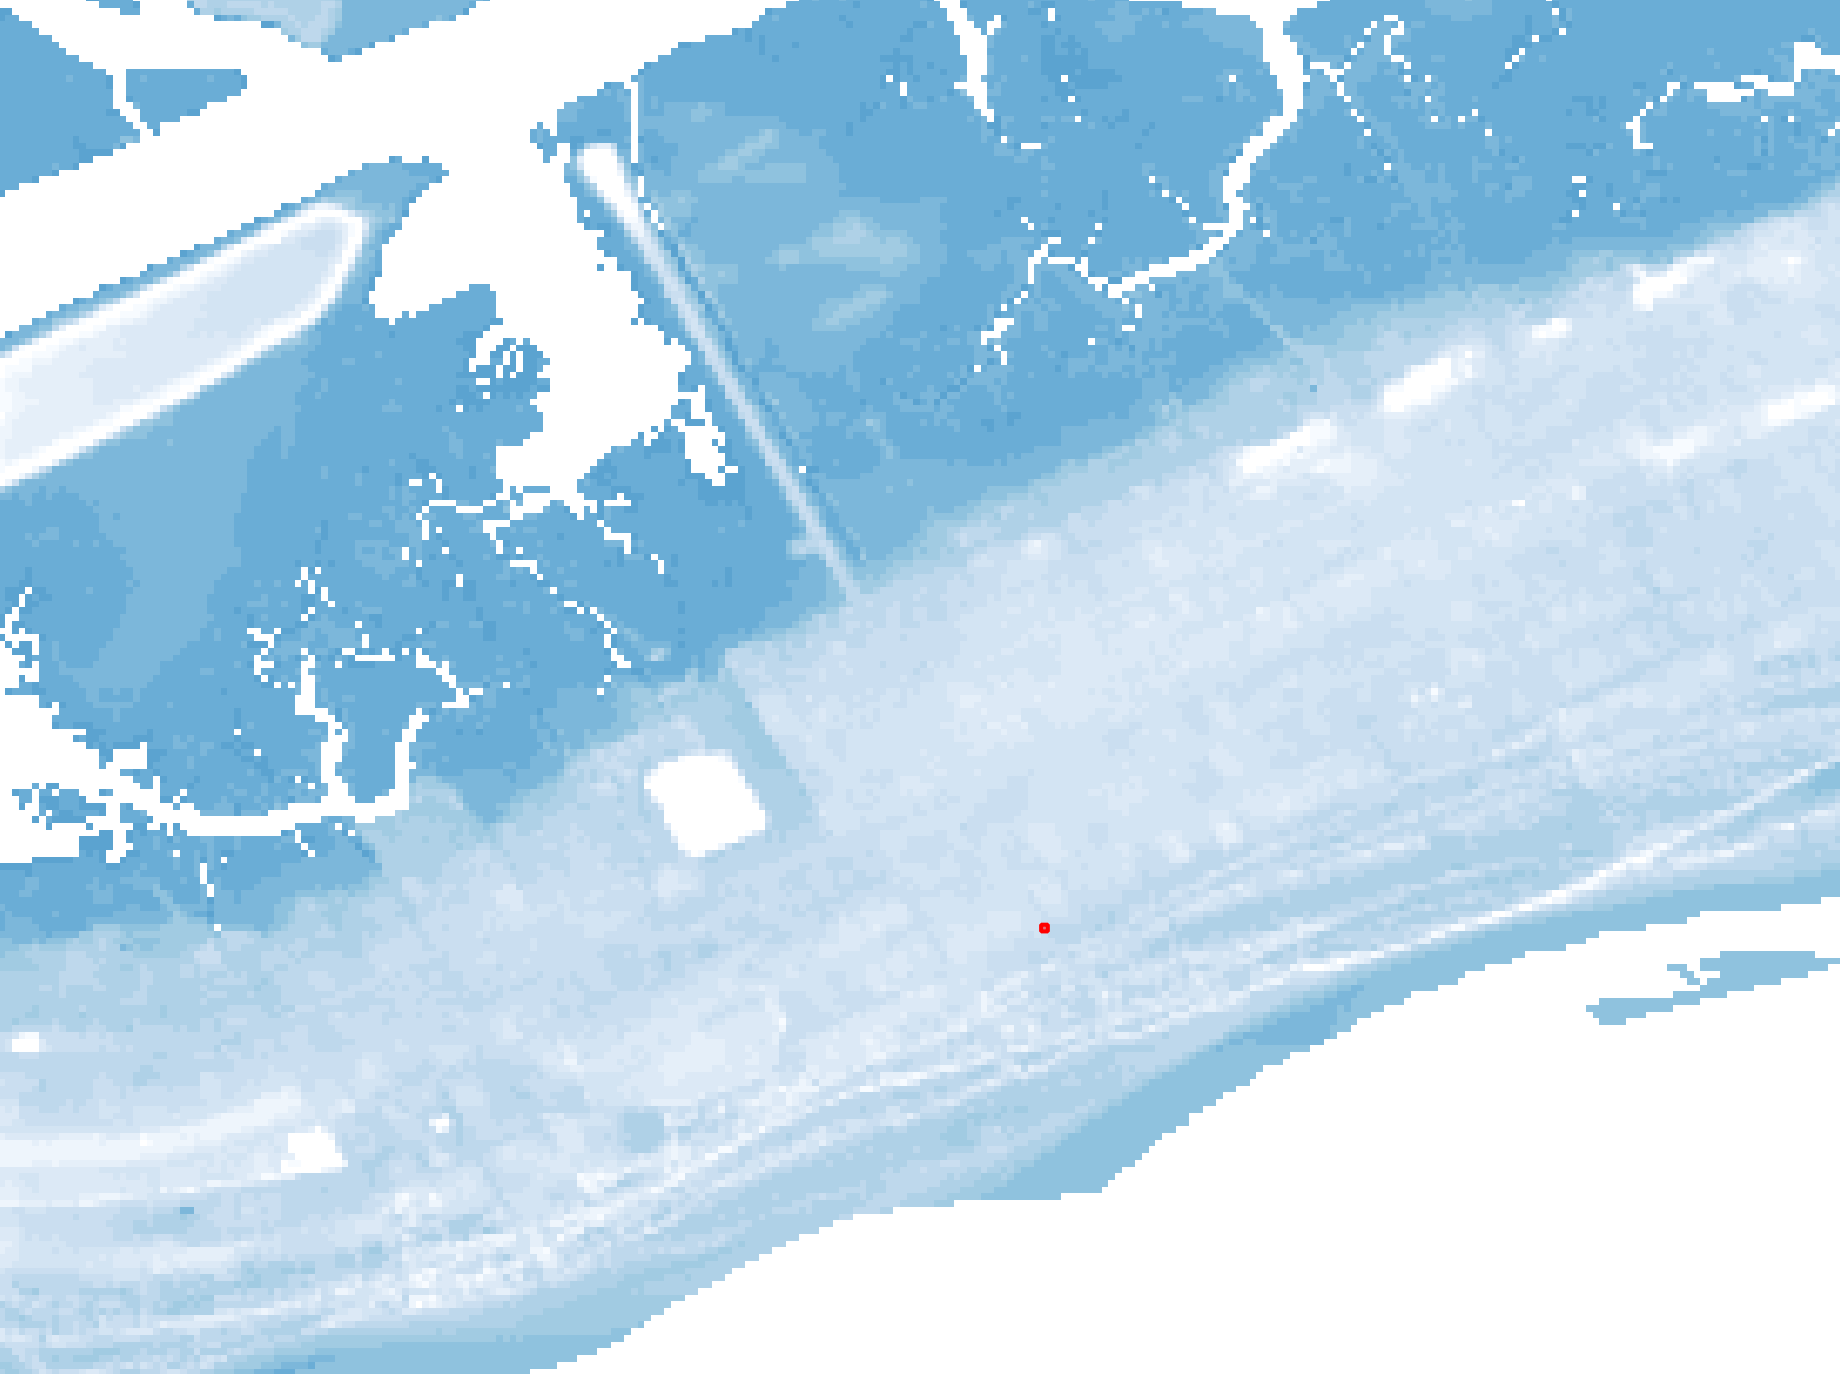
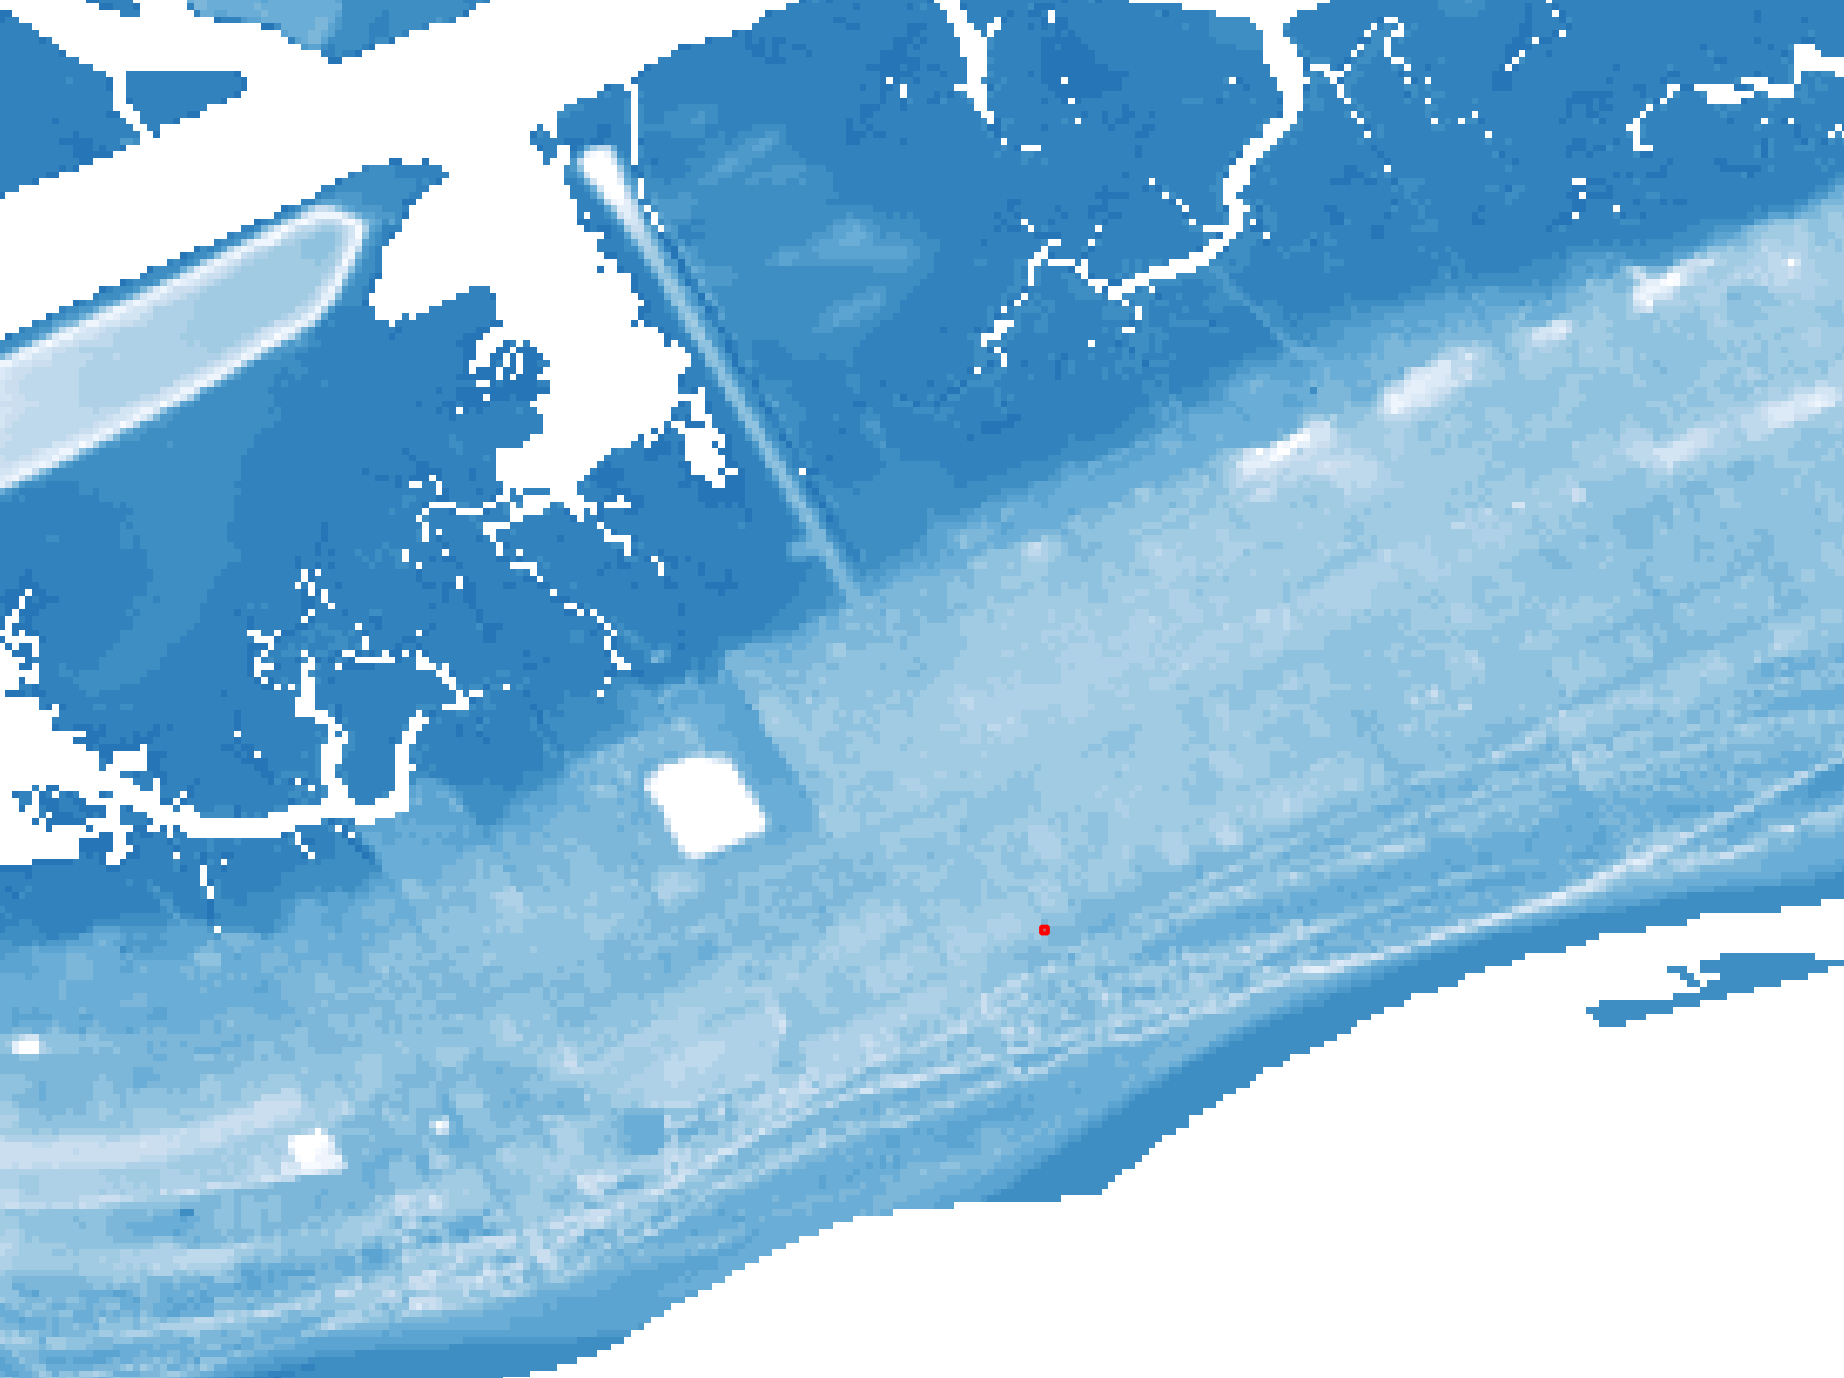
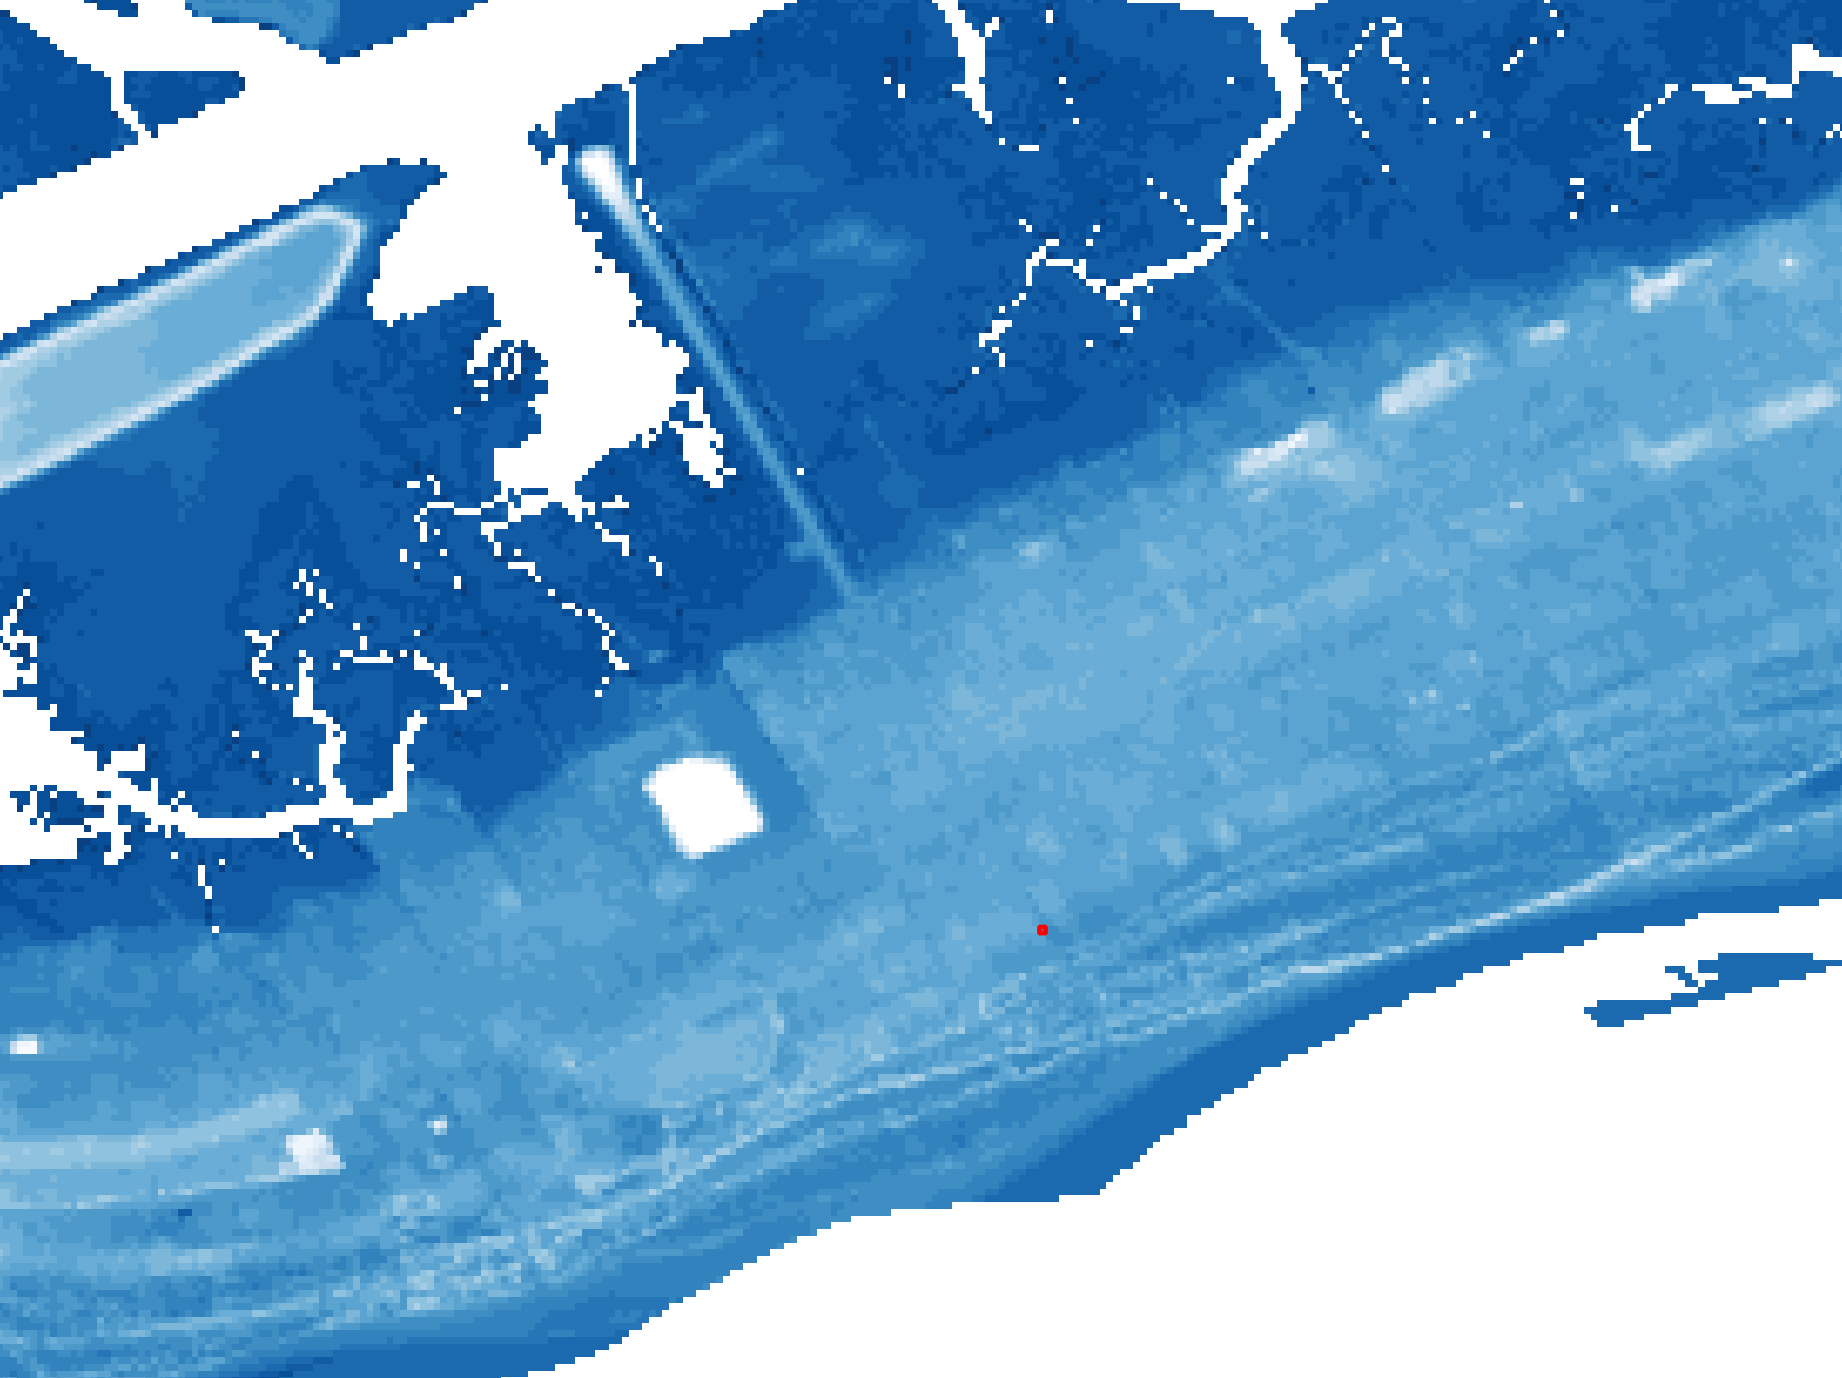
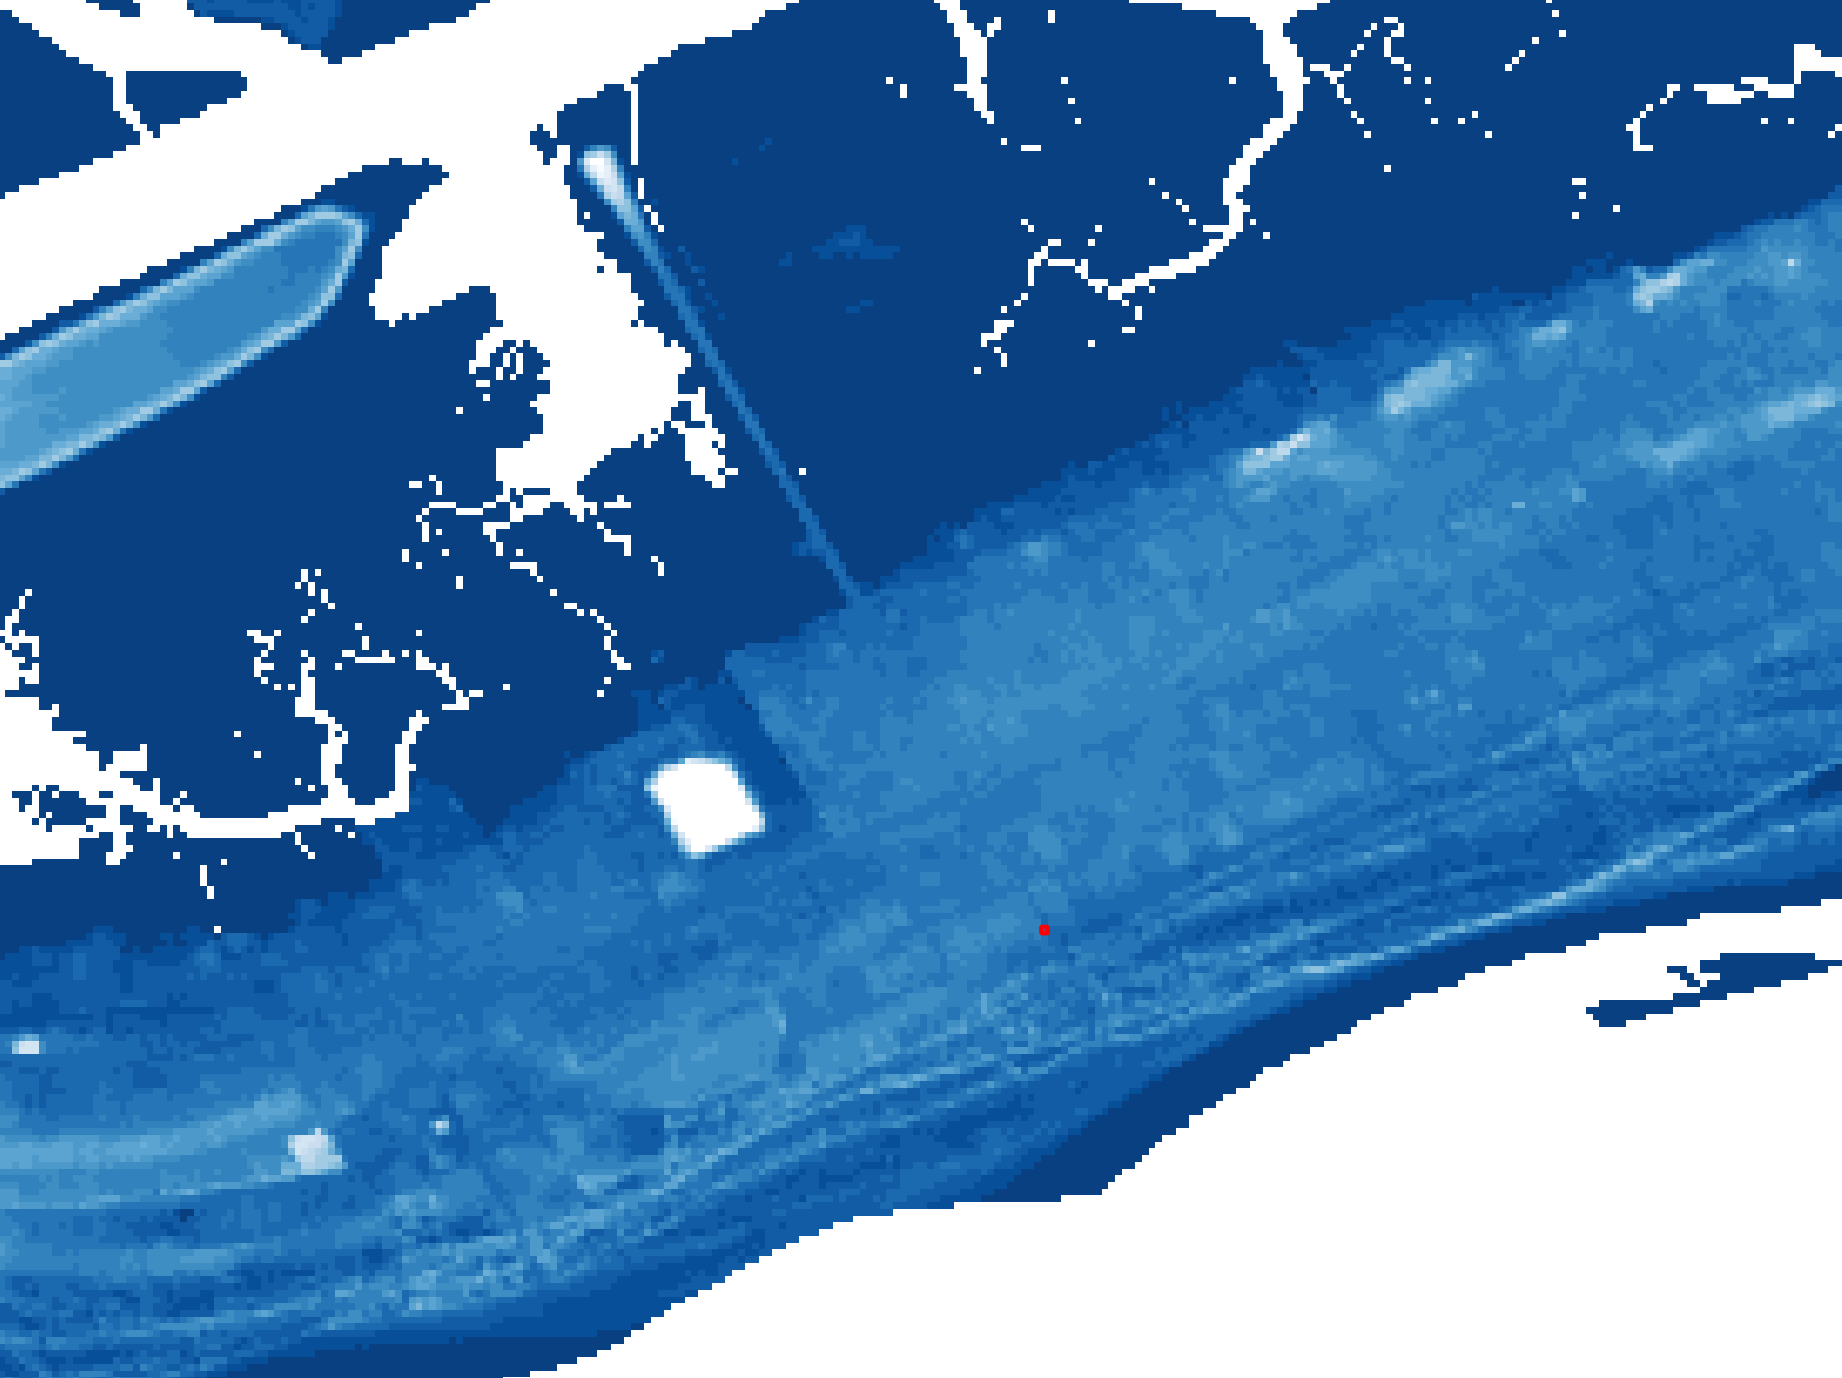
The USGS Coastal Vulnerability Index (CVI) quantifies relative coastal vulnerability using six physical variables. Each factor is rated Very Low to Very High based on observed conditions along this coastal segment.
| Year | Event | Type | Estimated Damage |
|---|---|---|---|
| 1989 |
Hurricane Hugo
Category 4 at landfall near McClellanville, SC. 20-ft storm surge on northern Sullivan's Island. Catastrophic structural damage across the island.
|
Major Hurricane | $8.5B (national) |
| 1999 |
Hurricane Floyd
Category 2. Significant surge and coastal flooding along Sullivan's Island and Isle of Palms. Multiple structures damaged.
|
Hurricane | $1.2B (SC) |
| 2015 |
Historic October Rainfall
1,000-year rainfall event across coastal SC. Extensive inland and coastal flooding. Sullivan's Island roads impassable for several days.
|
Extreme Rainfall | $1.5B (SC) |
| 2019 |
Hurricane Dorian
Category 2 brush. Storm surge of 3–5 ft across the Charleston metro. Flooding of low-lying roads and properties on Sullivan's Island.
|
Hurricane | $187M (SC coastal) |
| 2022 |
Hurricane Ian (Remnants)
Tropical moisture produced sustained coastal flooding and above-normal tidal surge along the SC coast.
|
Tropical Remnants | N/A (SC impact) |
The following recommendations are tailored to this property's specific risk profile. They are ordered by priority and estimated cost-effectiveness for long-term resilience.